

Within the last few days, analysts have fallen in love with Verizon Communications (NYSE: VZ). The telecom giant has had a rough year so far, only having risen 2% since January 1st. However, share prices are starting to surge this week, suggesting that a big move could be on the horizon.
But analysts – particularly those of a fundamental mindset – still see VZ as undervalued in terms of future cash flows discounted to today’s value (using the Discounted Cash Flow, or DCF, model).
The DCF model, while not perfect, is the preferred analysis method of many financial soothsayers. I personally don’t use it, but that’s because I come from a different school of thought (technical analysis) for evaluating stocks.
Still, though, I thought it would be interesting to take a look at what fundamental analysts are raving about before examining VZ through a more technical lens.
Verizon Communications By the Numbers
Using the 2-stage growth model, we’ll assume that VZ will initially have a higher growth rate (stage 1) before becoming more stable (stage 2).
In the first stage, we’ll estimate VZ’s cash flows over the next 10 years using analyst estimates and past free cash flows (FCF) to made educated guesses. Because dollars depreciate over time, we’ll discount the cash flows to today’s value.
10-year FCF forecast
| 2020 | 2021 | 2022 | 2023 | 2024 | 2025 | 2026 | 2027 | 2028 | 2029 | |
| Levered FCF ($, Millions) | $19.5b | $19.6b | $20.8b | $22.5b | $23.5b | $24.4b | $25.2b | $26.0b | $26.9b | $27.7b |
| Growth Rate Estimate Source | Analyst x10 | Analyst x3 | Analyst x2 | Analyst x2 | Est @ 4.29% | Est @ 3.82% | Est @ 3.49% | Est @ 3.27% | Est @ 3.1% | Est @ 2.99% |
| Present Value ($, Millions) Discounted @ 7.5% | $18.1k | $17.0k | $16.7k | $16.9k | $16.4k | $15.8k | $15.2k | $14.6k | $14.0k | $13.4k |
Present Value of 10-year Cash Flow (PVCF)= $158.1b
Source: Yahoo Finance
Now that we have the present value of future cashflows from the initial 10-year period (stage 1), we need to find the Terminal Value, which looks at future cash flows in stage 2.
The Gordon Growth Model (GGM), created by Myron J. Gordon in 1956, can help us do that. For the GGM, we assume a future annual growth rate equal to the 10-year government bond rate of 2.7%. In addition, we’re discounting terminal cash flows to the current cost of equity (7.5%).
Terminal Value (TV) = FCF2029 × (1 + g) ÷ (r – g) = US$28b × (1 + 2.7%) ÷ (7.5% – 2.7%) = US$596b
Present Value of Terminal Value (PVTV) = TV / (1 + r)10 = $US$596b ÷ ( 1 + 7.5%)10 = $289.15b
Source: Yahoo Finance
Based on our calculations, VZ’s total value (or equity value) is $447.23 billion, which is the sum of the present value of future cash flows.
Finally, we divide that figure by the number of total outstanding shares.
The result is an intrinsic value estimate of $108.13 per share. VZ currently trades for only $56 per share.
Meaning, that according to the DCF model (along with the GGM), Verizon Communications is woefully undervalued. Despite solid financials, investors have been selling VZ in 2019.
Trade war uncertainty is likely to blame for VZ’s rough year. But to fundamental analysts, it’s provided a huge buying opportunity.
To me, though, the DCF model should not be used to identify trade opportunities. Particularly in this situation, where VZ has “chopped sideways” for months now.
In order to make the calculations above, we relied on analyst estimates and guesswork – two things that are often proven wrong come earnings season.
Instead, the only evidence I care about is on the chart itself. But even there, VZ looks ready for a huge move.
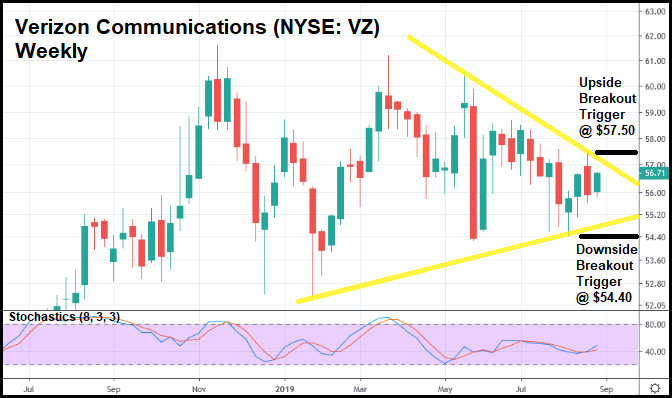
In the weekly candlestick chart above, you can see that VZ has traded itself into a triangle. Unlike the last few we’ve featured, though, this one is far more “balanced”, with upper and lower trendlines that have steeper slopes.
What that gives us is an opportunity to go either long OR short depending on how VZ trades these next few weeks. If share prices move past the upper trendline, going long at $57.50 in anticipation of an upside breakout might make sense.
Similarly, going short should VZ trade below $54.40 could also prove to be a solid move preceding a breakout to the downside.
The stochastics support both strategies as well, as the current reading sits right around 50 – smack dab in the middle of the range.
Based on our fundamental analysis alone, an investor would run out and buy VZ immediately. But with a more technical approach, we’re ready to capitalize on its movement in either direction.
Better yet, in looking at the chart, we’re not forced to make any assumptions. We simply take what VZ is giving us in order to make plans for the future, contingent upon where the stock goes.
That “flexibility” is extremely valuable, and proof to me of just how powerful technical analysis can be.
Especially during times like these, where the market could do nearly anything at the drop of a hat.


