

Whenever the market hits a period of volatility, otherwise good setups suddenly start to look very messy. Red and green candlesticks alternate, one after another, sometimes in the direction of a singular trend – meaning that a potential trade could be buried in there somewhere behind the choppiness.
But because of the “up and down” daily candlesticks, plenty of technical traders avoid such an opportunity.
Even if a trend can plainly be discerned from the charts.
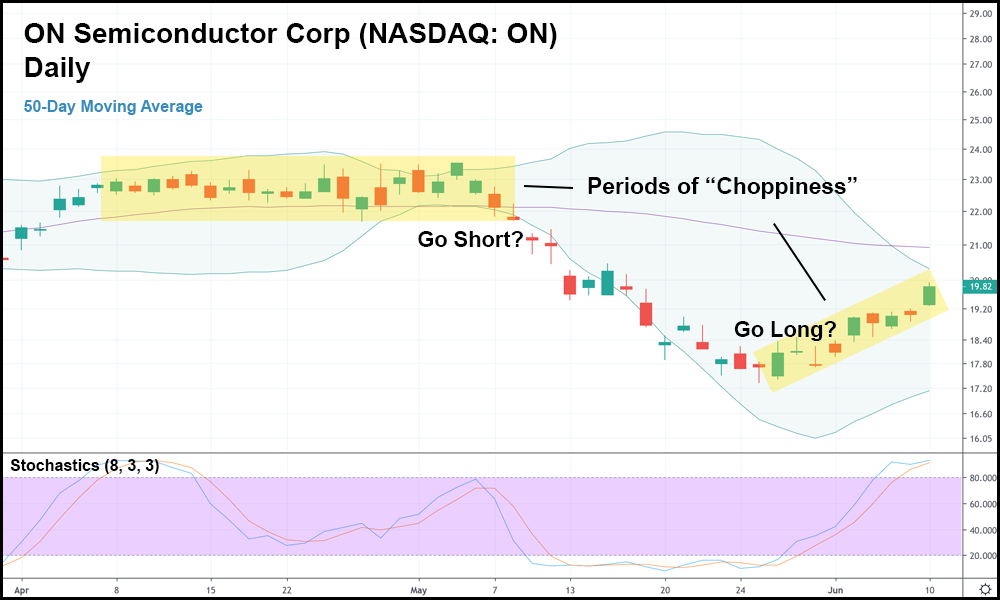
ON Semiconductor Corp (NASDAQ: ON) is a great example of this. On the daily candlestick chart above, you can see that back in April, ON was caught in some sideways chop. Once it started to fall, however, a potential setup formed in early May.
But based on the price action in April, I don’t think any technical traders would’ve really felt great about taking ON short after it jumped around the same price point for so long.
And of course, it eventually dropped, and a nice gain was awaiting anyone who took a chance on it.
Similarly, in late May, ON started to chop again. But this time, it was trending upwards with a bizarre pattern of alternating red and green candlesticks.
Again, it’s not picture perfect, but it still could end up being a great long opportunity – especially considering the fact that it’s a semiconductor (tech) company in a sector that got hammered in May and now looks oversold.
But outside of anecdotal evidence, we also have the weekly candlesticks to prove my point:
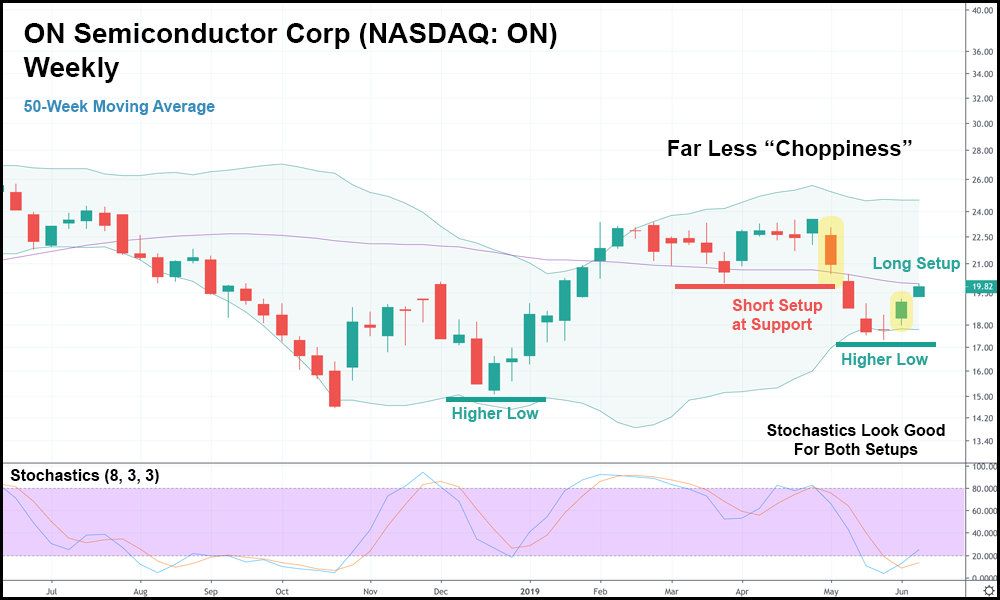
On the weekly chart, trends become much clearer. Moreover, we can see that the April short setup looks like more of a no-brainer. A breakthrough past support served as our entry point in the week following the yellow highlighted candlestick, and a “double top” (a signal of a reversal) even formed in the weeks before.
But now that the sharp fall has ended, ON actually set a higher low. Moreover, the yellow highlighted green candlestick closed above the highs of the previous two weeks, where contact with the lower Bollinger Band was made.
Overall, the long setup looks almost bulletproof, but it’s something we would’ve avoided had we not changed our perspective a little bit by looking at the weekly candlesticks.
I know you’re probably sick of hearing that by now, but during times of high volatility (like we’re in right now), taking a longer-term view can make things much clearer.
And when it comes to trading, I’m all about making analysis as easy as possible – even if that means changing how we look at a trade by altering period lengths.


