

Banco Bradesco SA (NYSE: BBD) is, simply put, a true swing-trading gem. Over the last year, it has generated winning trade after winning trade, with very little downtime in between.
In late July, we featured a BBD short setup after a “double top” formation appeared on the Brazilian bank stock’s chart.
Shortly after, share prices sunk like a stone, dropping until our pre-determined exit point of $8.00. BBD ended up falling further, but not by much, meaning we managed to capture almost all the stock’s downwards movement.
It was a great trade, no bones about it.
But now, just a few weeks later, things are looking up for BBD. The whole market has been lifted by some newly discovered trade war optimism – which may or may not be valid – causing plenty of stocks to recover after what was a dreadful August.
Bank stocks in particular (like BBD) have enjoyed a nice lift. Especially those of a more “international” flavor.
Meaning that a little over a month after our last BBD trade, we’re being presented with a trend reversal to the upside.
Along with a nice setup to boot.
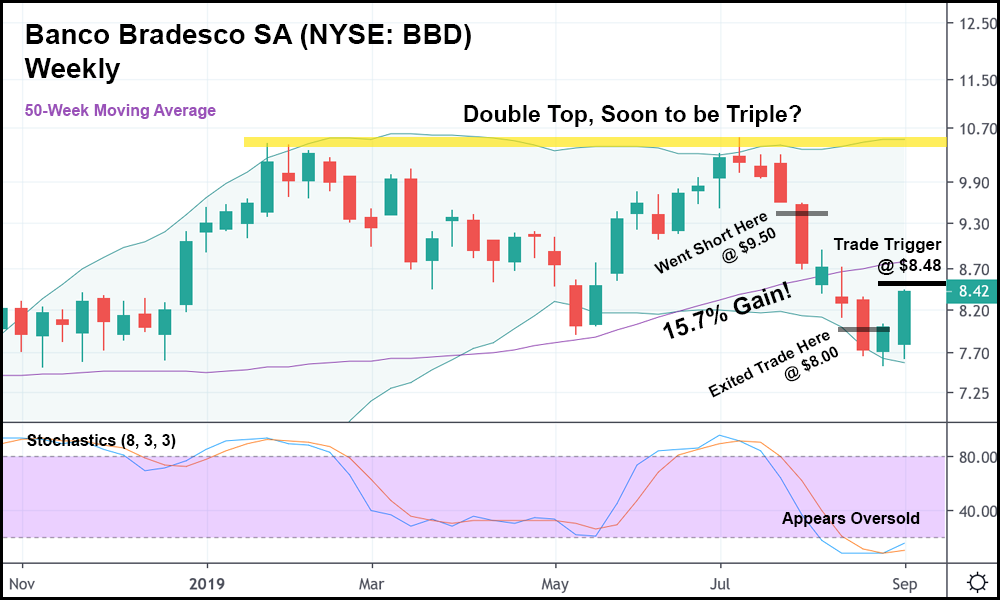
In the weekly candlestick chart above, you can see how our last trade played out. We went short at $9.50, watched BBD crater, then got out around $8.00 right before BBD slammed into the lower Bollinger Band (BB).
Had we used an appropriately priced and dated put option for this trade, it would’ve generated well over a 100% return.
Then, last week, BBD started to recover. It touched the lower BB again, but ended up rising this time by week’s end. This week, the recovery continues.
And with BBD trading above the last three candle bodies for the current weekly candlestick, it might make sense to set a long trade trigger above the high of the current week (at roughly $8.48).
Should BBD share prices eclipse this price point, a trend reversal could be confirmed.
But much like Ford Motor Co. (NYSE: F), which we looked at yesterday, we need to be wary of resistance hanging overhead.
The double top that formed – which often indicates a reversal to the downside – should provide significant resistance in the event that BBD shares end up trading that high.
Exiting the trade around that point might make sense if BBD can’t break out past $10.55, where resistance lies.
And though the upside to this trade may appear somewhat limited, a rise to $10.55 would still be a gain of roughly 25% from our trade trigger in the chart above.
I’m not sure about you, but a 25% gain sounds pretty alright to me. Just imagine what an in-the-money call option could achieve with that movement.
Now, one last thing to be wary of is the fact that BBD just recently set a lower low. It could be starting a downtrend, so share prices might not make it all the way back up to form that triple top at $10.55.
Still, a gain of around 18-20% would be nothing to scoff at if share prices do indeed rocket upwards.
And based on what the chart has shown us over the last month, an impressive surge from here on out looks more likely than not.


 In Trouble Again")
