

The market’s really trying its best to set a new all-time high, but thanks to some oil market drama in Saudi Arabia, it’s just not happening.
On Saturday, a strike force of unknown origin attacked the Saudi oil industry, effectively cutting the nation’s output in half. President Trump is authorizing the release of emergency oil reserves to offset a Brent crude price hike (currently at 10%), but as of midday, it appears the damage has already been done.
Uncertainty is riding high as well, after another surprise, market-bending event took place. A few weeks ago, the Hong Kong protests had a similar effect.
Equities opened lower today as a result and continue to drop. Stocks made a slight recovery in the trading session’s early A.M. hours but ended up retracing those gains. General Motors (NYSE: GM), which is caught in the middle of a nationwide UAW strike, isn’t helping matters, either. Share prices for GM were down almost 4% on the day as of noon.
But I don’t want to focus on oil prices or GM in today’s column. Instead, we need to take a look at what’s building up to be a “critical moment” for the market – something that could end up dictating where stocks are headed for the next week or two.
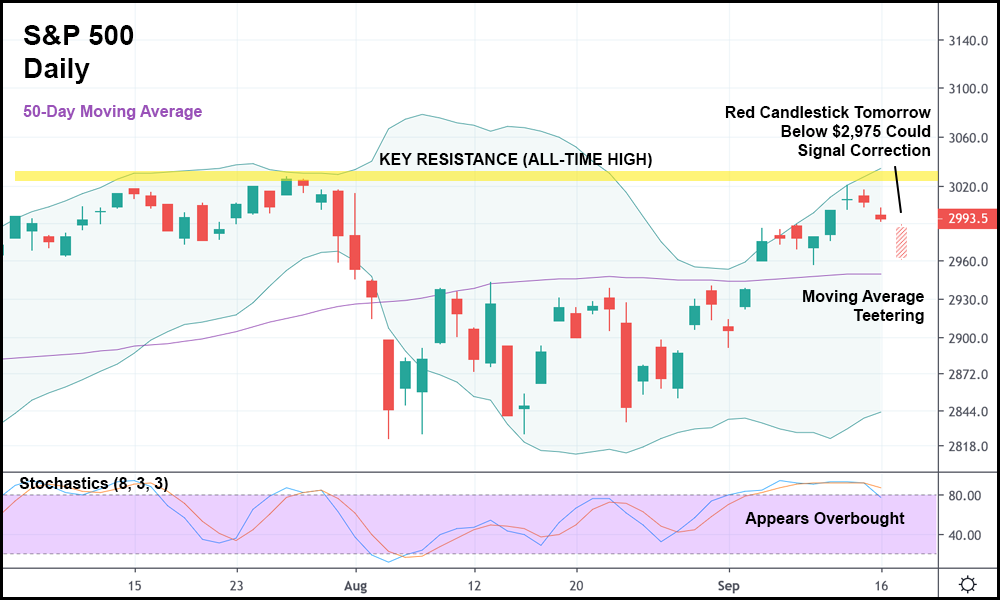
In the daily candlestick chart above, we’ve plotted the S&P 500’s movement since mid-July. In late July, the S&P 500 set a new all-time high at $3,027.98, right before plummeting in early August.
Back when that happened, I was watching for a correction. Yes, a record-setting high is certainly exciting. Analyst and investors alike were celebrating it.
But what came just a few days later on July 31st – a loss of 1.09% – suggested (to me, at least) that the wave of optimism might be over. The next day, the low of the 31st was taken out, confirming it.
Then the market toppled, dropping an additional 3.68%. Equities were “stuck” around that price for the entire month of August, before breaking out past resistance on September 5th, sparking a slight rally.
However, contact with the upper Bollinger Band (BB) was made two trading sessions ago, and since then it’s been tough sledding for bulls. Prices never even hit key resistance (the thin yellow line in the chart), meaning that if stocks drop further, a lower high will have been set.
And if the market sets a lower low (below the August low) after that?
Look out, because a full-on correction could be in the works.
If the S&P 500 drops below today’s high during tomorrow’s trading session by a sufficient amount (below $2,975), the “sell sign” could be on for the general market. Much like a stock we would typically short, the S&P 500 has checked all the bearish boxes.
Contact with the upper BB was made, stochastics are sky-high, and the current daily candlestick is trading below the last two. Another “bad” day for stocks would make a further drop seem probable, if not inevitable.
Now, I’m not saying that the market is about to hit the skids long-term. It’s probably not going to.
But don’t be surprised if we see the indexes tumble over the next week. If that happens, they’ll probably consolidate, setting a higher low en route to a new all-time high.
Which will have bulls undoubtedly overbuying growth stocks once again, business as usual.


 In Trouble Again")
